


nacos环境部署及测试
nacos环境部署这里就不讲了,不会的可以参考官方文档
访问测试 192.168.1.243:8848/nacos/actuator/prometheus 格式为 主机ip:8848/nacos/actuator/prometheus 访问到数据即可

修改Prometheusyml文件
格式为下图
  - job_name: "nacos"
    metrics_path: '/nacos/actuator/prometheus'
    static_configs:
      - targets: ['ip:8848','ip:8848']
重启Prometheus
docker restart prometheus查看是否监控到 
grafana添加监控模版
导入 13211 
去除非8848结尾的主机 并去除全部按钮
模版中点击设置 !
然后点击
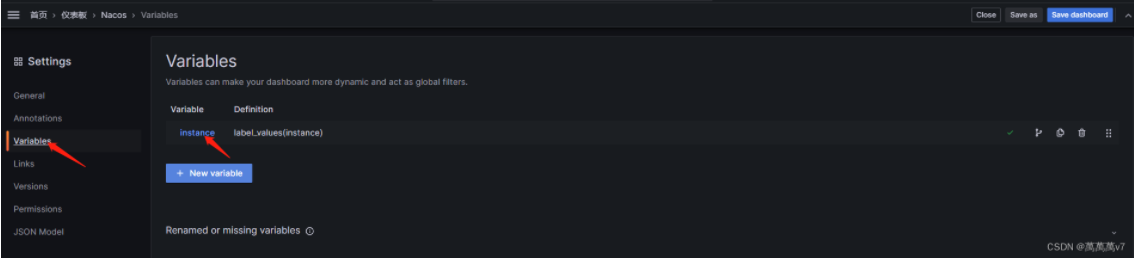 其他地方不用动只需要添加正则
.*:8848$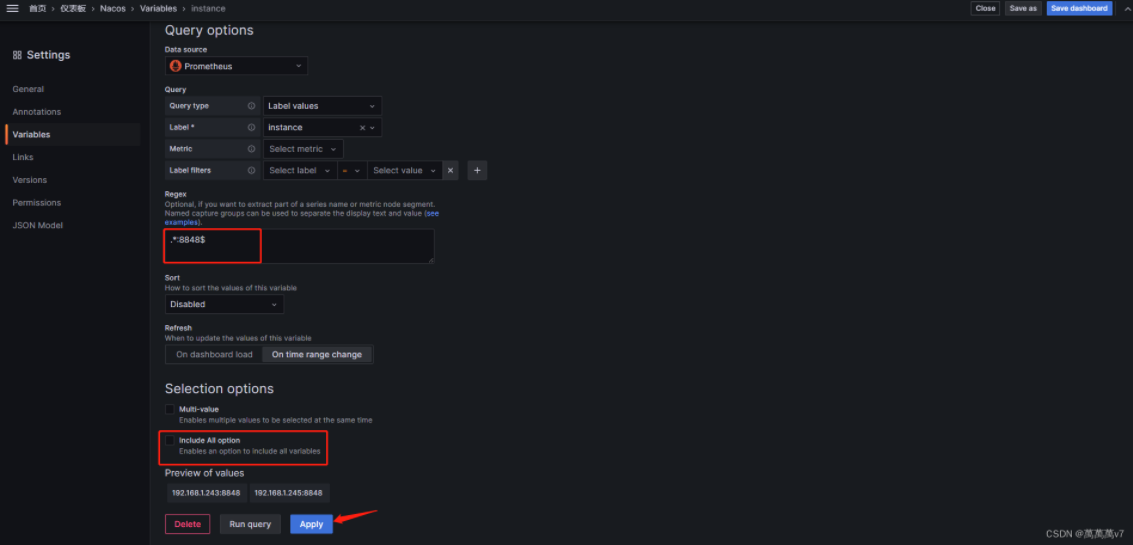 把包括所有选项(Include All option)的对号取消 点击appil保存
刷新查看就只有nacos的主机展示 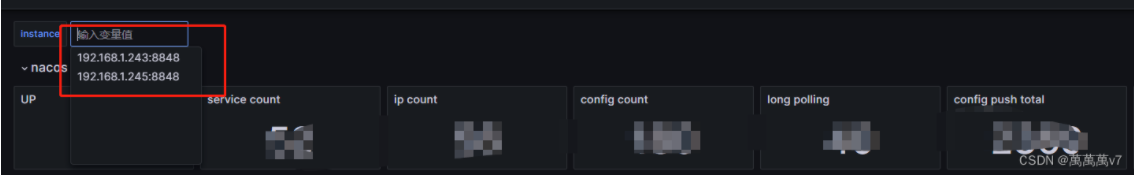 完事。。。
完事。。。
评论区